

Q1 2019: 2018 Review & 2019 Investment Outlook
2018 YEAR IN REVIEW
Investment and economic conditions were solid heading into 2018, and the market began on a great note for market bulls. Unfortunately, the market corrected during the last quarter, and the market ended on an otherwise dreadful note, notwithstanding a rally effort in the last few sessions.
How good was the start? The S&P 500 gained as much as 7.0% in January before closing out the month up 5.6%. How bad was the finish? The S&P 500 had fallen 15.0% since the close on October 1, but it had been down as much as 19.8%. At one point, the S&P 500 was down 15.0% for the month of December alone!
What happened?
The answer is that a lot happened in between to drive a major swing in investor sentiment and a major upswing in volatility. The constant throughout the year, though, were ruminations about interest rate moves.

2018 S&P 500 Return (Dividends Reinvested – Blue, Price – Black)
GDP PICKUP
The roaring start to 2018 was a continuation of a roaring finish to 2017, which was fueled by optimism surrounding a fiscal stimulus plan that was approved and went into effect in 2018.
The central feature of the plan was a reduction in personal income and corporate tax rates, both of which were fuel that would drive a pickup in consumer spending, a pickup in business investment, a pickup in employee wages, and a pickup in earnings growth.
By and large, that vision was realized, only the pickup in some cases, like business investment and employee wages, wasn’t quite as strong as forecast.
The latter point notwithstanding, there was a clear pickup in GDP growth in 2018, which averaged 3.3% on an annualized basis over the first three quarters versus 2.5% for the first three quarters of 2017. That pickup was led by increases in personal spending following the implementation of the fiscal stimulus plan.
The economic momentum translated into revenue and earnings growth momentum for S&P 500 companies that was remarkable. According to FactSet, the 10.5% increase in second quarter revenue was the highest revenue growth since Q3 2011; the 26.0% EPS growth in the third quarter was the highest since Q3 2010; and the 20.3% earnings growth for calendar 2018 was the highest for the S&P 500 since calendar year 2010.
The economic and earnings growth momentum helped stabilize the market following a major drawdown in February that culminated with the first 10% correction for the S&P 500 in nearly two years — a correction that unfolded over just ten trading sessions.
That drawdown got going on a sense that the market had gotten overextended, but it shifted into a higher gear following the release of the January employment report, which revealed a larger than expected increase in average hourly earnings that ignited concerns about the Federal Reserve (“Fed”) raising rates aggressively to keep inflation in check.
It was the collapse of short volatility ETFs, though, that forced some panicky selling that took the S&P 500 down as much as 10.3% in February. By the end of the month, the S&P 500 was down “just” 3.9%.
The ability to regroup was helped in part by the good earnings news, as previously mentioned, yet it was also helped by a rationalization in the market’s mind that rising interest rates were a good thing in the sense that they went together with an improving economy that would be good for earnings growth. The market sentiment about rising rates would shift 180 degrees in the final quarter of the year which goes to show how fickle market sentiment and emotions can be and their impact on short-term volatility and pricing. More on this point later.
TRADE ISSUES
Eventually, the S&P 500 would climb to a new record high of 2940.91 by September 21, shaking off many concerns along the way, like rumblings over the potential dissolution of NAFTA, talk of peak growth in economic activity and earnings, the inability of the UK to come up with an agreeable Brexit plan, and a protectionist trade policy pursued by the U.S. in an effort to cut trade deficits with major trading partners.
The protectionist action featured the implementation of tariffs on imports of steel and aluminum, and more comprehensive tariff action on more than $200 billion worth of goods imported from China.
The U.S., Canada, and Mexico ultimately reached an agreement on a new NAFTA deal, known now as the United States-Mexico-Canada agreement
(USMCA), which is still awaiting Congressional approval; the US and European Union ultimately agreed not to hit each other with new tariffs as they engaged in talks aimed at reducing tariffs and trade barriers; and the U.S. and China ultimately agreed not to escalate tariff actions further for 90 days (ending March 1, 2019) as they try to work out a deal to correct structural trade issues.
The trade war with China was an overhang all year, yet it didn’t hit the stock market that much since the impact of the tariffs, and retaliatory tariffs, hadn’t shown up to any significant degree in the data — other than in imports from China, which were pulled ahead to circumvent impending tariff actions.
Nevertheless, as the year ended, the stock market was plenty pre-occupied with worries about U.S.-China trade relations. There was concern that a trade agreement wouldn’t be struck in the prescribed time window, raising the specter of the U.S. following through on a threat to raise its tariff rate on imported goods from China to 25% from 10% and to put new tariffs on even more Chinese imports.
The U.S. and China are holding trade talks this week, and it’s safe to say that those trade discussions, and others that may follow, will be a focal point at the start of 2019.
FED UP
Turning back to 2018, the Fed factored prominently in trading matters, not only because it elected to raise the target range for the fed funds rate four times and cut the size of its balance sheet in an effort referred to as “quantitative tightening” (the converse of “quantitative easing”), but also because those actions were derided by President Trump as being misguided.
President Trump didn’t hide his feelings about the Fed’s actions, saying he wasn’t happy with his pick of Jerome Powell to be Fed Chair. That public criticism created some nervous trading behavior in the stock market, which felt the Fed’s independence was being put to the test by the president’s remarks in a way that made it impossible for the Fed not to raise rates.
Fed Chair Powell made it clear, after the Fed elected in December to raise the target range for the fed funds rate for the fourth time this year, that the Fed is not swayed by political opinions and that its decision making is entirely data dependent.
That reminder came at the same time updated projections from the Fed revealed a median estimate for two more rate hikes in 2019.
The stock market wasn’t a fan of the rate-hike outlook, and it was left to think the Fed might be on course to make a policy mistake by raising rates too much.
That consideration contributed to a major downturn in the month of December, which added to losses that started to mount at the start of October as peak growth concerns hit home amid a steady stream of disappointing data from abroad, a flattening of the yield curve, and ugly performances by cyclical sectors here at home, and stocks in general, that were viewed as harbinger of slower growth ahead.
The best manifestation of those growth concerns was the compression in the P/E multiple despite the S&P 500 being on track to deliver its best year of earnings growth since 2010.
To that end, the forward 12-month P/E/ multiple for the S&P 500 stood at 18.3x entering 2018. Today, it stands at 14.4x, a significant discount to its 10-year average.

THE END
The baby got thrown out with the bath water at the end of the year, including the FAANG stocks, which were all but invincible in 2017. The selling pressure on those names — Facebook, Apple, Amazon.com, Netflix, and Alphabet – was acute and was a major drag on the broader market given their collective market weight and how widely owned they are in passive and active funds alike.
Every sector was down at least 4.5% in December. In the fourth quarter, meanwhile, eight of 11 sectors saw double-digit percentage declines ranging from 10.3% (health care) to 24.7% (energy). The bloodletting in the energy sector was a byproduct of the bloodletting in oil prices, which collapsed 41% from their October 3 high on the back of concerns about excess supply and a global growth slowdown.
There was only one sector — the defensive-oriented utilities sector (+0.3%) — that had eked out a quarterly gain, but even this defensive sector is getting hit presently as fears of bankruptcy at California’s largest utility, PG&E, caused by the California wildfires are weighing on its shares.
A year that began with a bang on the back of optimism about the economic and earnings outlook ended with an audible thud on the back of concerns about the economic and earnings outlook.
The S&P 500 registered its first decline on a total return basis since 2008. That decline was relatively modest in scope, yet it will feel a lot worse given how significant — and rapid — the sell-off was from the all-time high hit in September.
2018 will also go down as an historical anomaly. To wit, the Stock Trader’s Almanac informs us that there has never been a down year for the market since 1950 when the S&P 500 has gained at least 4.0% in January.
The partial government shutdown was one more negative at the end of a year that had been primed to be a positive one but more recently turned into a negative one.
2018 Investment Index Performance Results
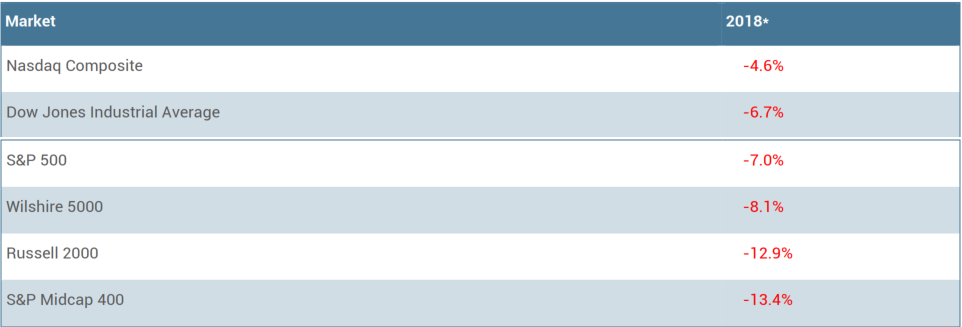
Source: FactSet

Source: FactSet
*Returns through December 28, 2018
MARKET OUTLOOK – JANUARY 2019
What we believe coming out of 2018 is that long-term investment prospects are looking better than they did entering 2018, and we are forecasting a total return for the U.S. equity market in the mid-teens for 2019.
ROOTS OF OPTIMISM
We understand our last statement is not above reproach. Critics are apt to make several reasonable-sounding rebuttals:
• Interest rates are higher.
• Earnings growth is peaking, and comparisons are getting more challenging.
• The trade dispute with China is unresolved and has potential to explode with increased tariffs and higher tariff rates.
• Global economic growth is slowing and the impact of fiscal stimulus in the U.S. is fading.
• Credit spreads are widening.
• The UK is on course for a messy divorce from the European Union.
• The U.S. Congress is a house divided, which is a likely roadblock to passing growth-oriented legislation, like an infrastructure bill, and perhaps a roadblock for a conciliatory agreement to raise the debt ceiling.
• The risk of a monetary policy mistake is rising as global central banks try to extricate themselves from crisis-era policy management.
Those aren’t the only rebuttals, but that’s a start on the many things to think about when making a case for the investment outlook.
The basis for our more optimistic-minded investment case is rooted in the following:
• Entering 2018, the forward twelve-month P/E multiple for the S&P 500 stood at 18.3x. Exiting 2018, it stands at 14.2x, which is
a discount to its 10-yr average.
• Entering 2018, the S&P 500 earnings yield (as defined by earnings/price, the inverse of the price/earnings ratio) was 5.46%, 303 basis points higher than the 10-yr treasury note yield. Exiting 2018, the S&P 500 earnings yield is 7.14%, 435 basis points higher than the 10-yr note yield.
• Entering 2018, the core PCE inflation rate stood at 1.6%. Exiting 2018, the core PCE inflation rate stands at 1.9%, which is still below the Federal Reserve’s longer-run target.
• Entering 2018, the Federal Reserve projected three rate hikes in 2018 (and raised rates four times). Exiting 2018, the Federal Reserve is projecting two rate hikes in 2019 and acknowledging that it is closing in on the neutral rate, and if you look at the bond market, it is indicating only one Fed rate hike for 2019.
• Stock prices are lower on an absolute basis, which should be appealing for any long-term investor who still appreciates the fact that it is better to buy low and sell high. We’re certain Warren Buffett is feeling that way exiting 2018.
A SHIFT IN THE NARRATIVE
It’s possible that 2019 ends up being another down year, particularly if trade negotiations with China go awry, interest rates spike, or earnings growth estimates get slashed in a material way because there is a major downshift in the economy, if not an actual recession.
A long-term investor, though, should have a time horizon that is longer than 12 months, which is why we are building the case here that a long-term investor is in a better position to earn a positive return than they were entering 2018.
Valuation is less stretched; the Federal Reserve is presumably closer to the end of its rate-hike cycle than it was at the start of 2018; and the price dislocation at the end of 2018 has discounted the unfavorable variables, which is to say the market has gotten a head start in accounting for negative outcomes for possible adverse events such as the pace of economic growth and negotiations with China.
In other words, there will be less surprise if/when those variables possibly become reality.
That’s not to say there isn’t more downside to come. A bearish narrative has taken root, which is why there has been constant selling
into strength since October versus constant buying-the-dip through September.
That narrative incorporates a flattening yield curve, expected cuts to earnings estimates, an increased risk of a monetary policy mistake, misgivings about the U.S. and China working out a trade agreement, talk of a recession, the underperformance of leadership stocks/sectors, and the inclination to sell into strength.
In many respects, it is the converse of the bullish narrative entering 2018.
That narrative featured talk of fiscal stimulus fueling above-trend economic growth and strong earnings growth, rising interest rates being a symptom of a strong economy, resolute leadership from the information technology, consumer discretionary, and financial sectors, invincible performances from the FAANG stocks, and of course the ongoing success of buy-the-dip efforts.
WHAT IT ALL MEANS
Crowd psychology can be a major driver of market action and the mood of the investment crowd coming into 2019 is Scrooge-like. The persistent negativity could become its own positive catalyst, serving as a contrarian indicator.
These are short-term thoughts, though, which isn’t where we want to go with this perspective on the long-term investment outlook.
The environment isn’t ripe now for an all-in investment approach for the equity component of an investment portfolio, but with the sell-off exiting 2018, an opportunity has availed itself to put some money to work at more attractive valuations.
That perspective might not be very popular entering 2019 anymore than a perspective to lighten up on stock holdings was entering 2018.
Still, buying the market at a lower valuation is a better setup for long-term investor at a time when the short-term outlook is cloudy with a chance of increased volatility.
Most of remaining problems in the market are man-made (protectionist policies and government shut downs), and man-made problems tend to resolve themselves over the short-term, but on an otherwise unknowable timetable. A trade agreement with China will come out on an upcoming random Tuesday, perhaps after this week’s trade talks or perhaps not, and the government shut down will be resolved on some otherwise slow news day to achieve maximum effect. In either case, the market will react very favorably and those that didn’t stick at or near their long-term, strategic asset allocation for equities will miss out on the major rebound that will
happen in conjunction with these events.
These man-made events could get worse before they get better, and a good bet would say that they will, but now is the time to have the courage of your convictions to your long-term investment strategy and strategic weights to your equity vs bond allocation.
As always, I welcome your comments, and I look forward to sitting down with you to catch up and review your current portfolios.
Warm regards,
John P. Swift, CFA, CPA
CEO & Chief Investment Officer