

Q3: 2019 Market Outlook
Market Update – 3Q19
If you don’t know where you’ve come from, you don’t know where you’re going, or as Yogi Berra bewildering once said, “If you don’t know where you are going, you’ll end up someplace else.” Investors have rejoiced in the successful 2019 markets, but behind that successful year is the fact that it has been based on correcting errors made at the back end of 2018. To see where we are going, let’s first take a quick look at where we have been.
Irritable Powell Syndrome
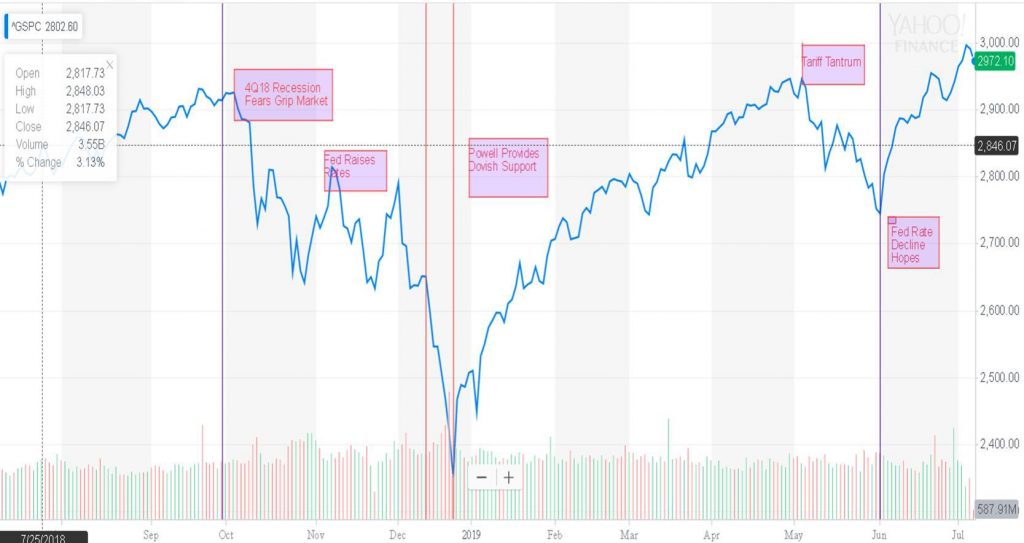
On December 19, 2018 the U.S. Federal Reserve under the leadership of Chairman Jerome H. Powell, raised the Federal Funds Rate to the present-day range of 2.25% to 2.5%. At the time, the Federal Reserve signaled that it expected additional rate increases in 2019 in a display of measured confidence in the economy that came despite financial market worries and political pressure to suspend rate increases. President Trump was pressuring the Fed Chairman to lower interest rates at the time, and many wondered aloud if the rate increase wasn’t partially motivated to signal the Federal Reserve independence from the Executive Branch. The interest rate increase in December now appears to have been a mistake in what I’m dubbing as a bout of Irritable Powell Syndrome. As you can see in the graph on the previous page, it took until May, 2019 to get back to the market levels achieved prior to the 4Q18 meltdown which was caused by the Fed actions and investor concerns that they were making a policy mistake that was going to push the U.S. economy into a recession.
Trump Tariff Tantrum
At that time our 2019 prediction was as follows (1Q19 Market Outlook, 1/8/19) “What we believe coming out of 2019 is that long-term investment prospects are looking better than they did entering 2019, and we are forecasting a total return for the U.S. equity market in the mid-teens for 2019″. At the time, we were going against the popular opinion that the market was positioned for further losses.
We were sailing along in early May, 2019 back to our previous pre-4Q18 levels when an unexpected tweet from President Trump on May 5th hit the social media site that indicated that the Chinese were reneging on a proposed trade deal and the President indicated he would increase tariffs on over $200 billion worth of Chinese goods to 25%. The market had been assuming that the trade deal was imminent based on comments made by both sides of the trade negotiation. On May 5 th that assumption was crushed, and it appears that, although progress is being made towards a final trade agreement, it may happen much slower that anyone expects. Based on this major change in assumptions and the realized slow down in global trade due to the trade agreement friction, the Federal Reserve indicated that it would take a more accommodating stance towards policy interest rates, and a rate decrease of 0.25% is widely expected to be announced at the next Federal Reserve Open Market Committee Meeting on July 30-31. As you can see in the graph, with the prospect of lower rates, the market roared back in June, erasing the tariff tantrum losses of May.
U.S. Economic Outlook
A little over a year ago, the number of available jobs first broke even with the number of unemployed workers and those two statistics have continued to diverge, and we now have over 1 million more job openings than unemployed workers. Our unemployment rate continues to nudge downward, and presently only 3.6% of the workforce is unemployed. We haven’t seen unemployment figures this low since Jimi Hendrix took the stage at Woodstock on the morning of August 18, 1969 to close the festival. Believe it or not, cowboy star Roy Rogers was supposed to close Woodstock with a rendition of “Happy Trails.” We can all be happy that Roy declined the invitation and the world got Jimi instead. Fast forward 50 years (yes, I’m sorry, 50 years) and we’re all on our own Happy Trails in that the economy continues to operate at full employment without the inflationary wage increases normally associated with full employment. The latest hourly earnings increases clocked in at 3.2% year-over-year growth rate. Those are solid, but not inflationary figures for employment wage gains. The bottom line is that U.S. consumers are fully employed making steady, but not inflationary wage gains. That’s good news for an economy that depends on the U.S. consumer for 70% of its output.
But What About the Inverted Yield Curve?
The yield on a 10-year Treasury Note had declined below the yield on the 3-month Treasury Bill yield on May 24, 2019 which is a yield curve condition referred to as an “inverted yield curve”. The significance of an inverted yield curve is that recessions have been normally preceded by an inversion in the yield curve somewhere between 12 and 18 months historically. As you can see the inversion has disappeared recently as the market adjusts to the belief that the Federal Reserve will lower the Federal Funds rate at their next meeting which has an immediate impact on the short-end of the yield curve (think- 3-month Treasury Bills). The 3-month yield has dropped from 2.5% in May to just 2.14% today.
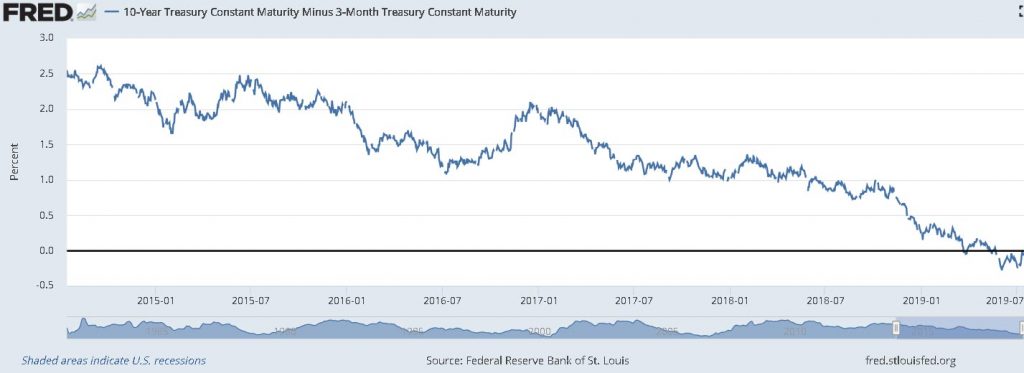
First, the inversion was based more on the fact that 10-year yields are pricing in an anticipated inflation rate of approximately 1.85% and a 0.3% real yield to arrive at the nominal yield today on the 10-year Treasury of 2.15%. The short end of the yield curve reflects the Federal Funds rate which the market has indicated is too high which has prompted the belief, backed by Fed acknowledgement, that the Federal Funds rate is highly likely to decline. When you add the fact that there is over $12 trillion dollars of negative-yielding bonds around the world creating additional demand for the positive-yielding, relatively safe U.S. Treasury market, this keeps prices higher and yields lower than if we did not have this additional source of positive yield seeking demand for our national debt. The bottom line on the inverted yield curve is that it is not reflecting the belief that a recession is imminent but does reflect a belief that inflation will remain stable over the immediate and intermediate terms. This is also very good news for the U.S. economy.
The Earnings Growth Outlook
The unmistakable irony is that the S&P 500 is nearing record highs despite the cut in earnings estimates and the threat of experiencing an “earnings recession” with a second straight decline in year-over-year earnings. It would only be a mini recession, though, considering first quarter earnings declined by just 0.3%. Nevertheless, earnings growth for the S&P 500 in the first half of the year has been elusive, partly because of tough comparisons, partly because of higher operating expenses, partly because of trade uncertainty curtailing business investment, and partly because of weakening global demand. There are a lot of moving parts to the earnings picture; and it’s fair to say that the stock market hasn’t been moved so much by the first half earnings outlook as it has been by the second half earnings outlook. The direct driver of the stock market, however, has been the persistence of low interest rates and the friendly reminder from the Federal Reserve that it stands ready to use its tools to keep the longest economic expansion on record going. That friendly reminder has enabled the stock market to steer through the lack of earnings growth in the first half of the year, because there has been an assumption that the low interest rates, and dovish policy approach, will invite a stronger growth environment in the second half of the year and beyond. If current estimates stay where they are, it’s really the back half of 2019 and 2020 where the meat of expectations lay. To wit, FactSet reports the consensus earnings growth estimate for third quarter earnings is -0.8% but then gives way to a hockey-stick ramp in the fourth quarter (+6.0%), first quarter of 2020 (+9.8%), and second quarter of 2020 (+13.5%). Those estimates are not going to remain static, and if history is any guide, there is a greater probability that they will be revised lower rather than higher. That will assuredly be the case if the trade deal standoff with China persists and/or new tariff actions are implemented. Conversely, a trade agreement could succeed in driving a more positive earnings growth outlook.
Q2 in View
Turning back to the second quarter, there have been a lot of warnings that have contributed to the downward consensus estimate revision. FactSet informs us that 88 S&P 500 companies have issued negative guidance, which is the highest number of companies since the first quarter of 2006. The revisions have hit far and wide. The only sector that has not seen a downward revision to its second quarter earnings growth estimate since the end of the first quarter has been the energy sector. However, the energy sector is still projected to report a 5.2% yr/yr decline in earnings. The sector sporting the highest estimated second quarter growth rate is the health care sector. However, the health sector is projected to report a modest 2.1% yr/yr increase in earnings. The information technology sector will be one of the weakest areas, as second quarter earnings are expected to decline 11.9% yr/yr, according to FactSet. But the information technology sector has gained 9.4% since the end of the first quarter while the health care sector has gained just 0.4% versus a 6.1% gain for the S&P 500. Fortunately, things look better for the top-line growth outlook. Second quarter revenues for the S&P 500 are expected to be up 3.7%. While that is down from a 4.5% growth rate forecast on March 31, it is underpinned by expected growth in all but three sectors. Strikingly, information technology (-1.1%) is one of those three sectors, which is the most influential drag there is. Energy (-1.1%) and materials (-15.0%) are the other two sectors. What jumps out is that second quarter revenues are expected to increase, yet second quarter earnings for the S&P 500 are expected to decline. That is the crossroad to margin pressures.
What It All Means to Investors
This has been some year so far for the S&P 500. It is up 16.9% year-to-date as of June 30th , and trading at a record high without any apologies — or earnings growth to speak of in the first half of the year. Falling (and low) interest rates have been the catalyst for multiple expansion. Currently, the S&P 500 trades at 17.1x forward twelvemonth estimates, which is a premium to the 5-year average of 16.5x and the 10-yr average of 14.8x, as determined by FactSet. We saw a footer in a CNBC segment recently that asked the question, “Can Q2 earnings justify the rally?” The answer is no, but the real question is, can the guidance justify the rally? There is a lot of hope in the afterlife following the first half of the year. It’s understandable, because hope springs eternal in a stock market that fears no evil with a Federal Reserve standing by its side. However, if global economic growth isn’t resurrected with rate cuts, and earnings estimates in the 2H19 and 1H20 don’t measure up, the stock market would have to atone for some first-half excesses.
As always, I look forward to hearing your comments and questions.
Warm regards,
John P. Swift, CFA, CPA
CEO & Chief Investment Officer