
The Fear of High-Tech Valuations
John P. Swift, CFA, CPA Chief Investment Officer
312-259-9595 or jswift@trustbenchmark.com
September 13, 2020
COVID Vaccine Podcast Now Available at www.Trustbenchmark.com
This past week we co-hosted an informative update on the status of the COVID-19 vaccine development with a focus on the candidates that have entered phase 3 testing, the final phase before FDA approval. Dr. Miles Varn, CEO of Pinnacle Health, was our speaker for this webinar which has now been posted on our website for your review.
A Mounting Tech Bubble?
Much of the recent financial news has been focused on the performance of the tech heavy NASDAQ Composite which had been up 76% since its March 23rd low but stumbled into correction territory recently (dropping 10% or more from a recent high constitutes a “correction”). Many saw this correction as inevitable given the massive run up in prices and the bubble in prices, they say, that has developed among technology stocks; notably within mega cap tech stalwarts, Apple (AAPL), Microsoft (MSFT), Amazon (AMZN), Facebook (FB), and Alphabet (GOOG.GOOGL).
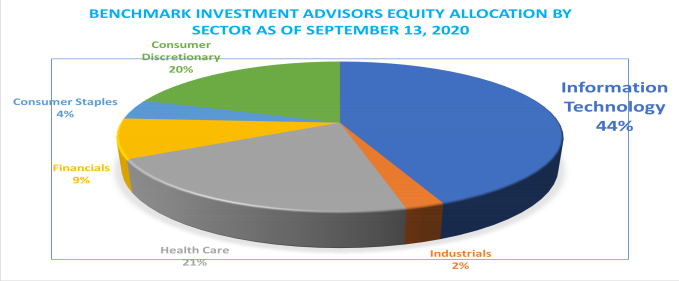
The Information Technology sector has significance to our clients as it has been a major source of our market outperformance. Presently, our composite of equity investments by sector, pictured below, shows that we have just over 44% of our total equity investments in the information technology sector. By comparison, information technology makes up just over 25% of the S&P 500. This sector overweight has served us well, but now with all the discussion about a valuation bubble we will turn our attention in this note towards exploring these claims, as well as discussing the Digital Payments and Semiconductors sub-industries within Information Technology that augment our core investments in the sector such as Apple (AAPL), Facebook (FB), Alphabet (GOOGL), Amazon (AMZN), Adobe (ADBE), Autodesk (ADSK), and Microsoft (MSFT).
Valuations in U.S. Technology: U.S. Technology is trading at an elevated multiple versus the broader U.S. market though the premium can be largely justified given the sector’s high quality, lower risk, and superior growth profile. Additionally, compared to the height of the Information Technology bubble in 2000, U.S. Technology is currently trading at a much lower Economic P/E multiple, offers higher quality (both via higher CFROI® levels and more Economic Profitability) and encompasses a higher portion of value creation in the broader market.
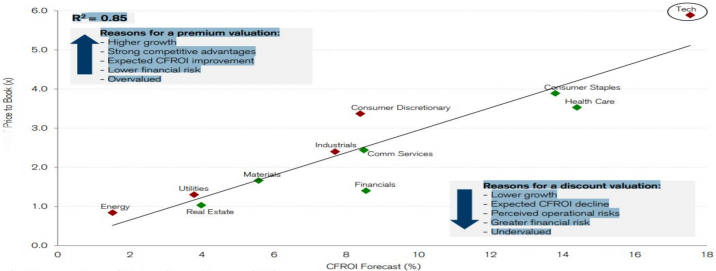
On the graph that follows, we highlight the high correlation between a firm’s Price-to-Book ratio and its Cash Flow Return on Investment (CFROI). Information Technology has the highest Price-to-Book and CFROI measures which is due to their higher growth, strong competitive advantages, expected further improvement in CFROI, and lower financial risk (low debt/equity ratios).
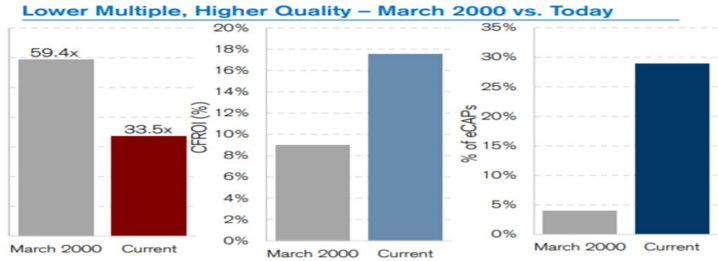
U.S. Technology Today vs. March 2000: Expectations today are nowhere near March 2000 levels, as the sector’s current P/E multiple is 33x vs 59x in March 2000. Technology is also much higher quality today evidenced by their higher Cash Flow Return on Investment (CFROI) levels, and the sector generates a greater portion of total Economic Profit (eCaps below) in the U.S. market than it did in 2000. On this last point, Economic Profit (eCaps) is the excess of CFROI over the industry’s weighted average cost of capital on the debt and equity employed.
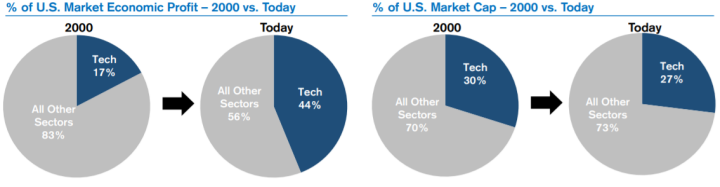
In the following pie charts, I am comparing the portion of the Economic Profits generated currently by the Information Technology sector (44%) versus what this industry generated in 2000 (17%), and today Information
Technology makes up slightly less of the total market capitalization as compared with 2000 (30% in 2000 vs 27% today).
Digital Payments & Data Processing – Superior Business Models and Secular Growth Driving Economics Profits: The Digital Payments & Data Processing industry has earned consistently high CFROI levels coupled with strong asset growth over the past decade, leading to robust Economic Profit expansion. The broader group has benefited from the shift to payment digitalization, which is likely to continue. Our investments within this sector include Mastercard (MA), Visa (V), Paypal (PYPL), and DocuSign (DOCU).
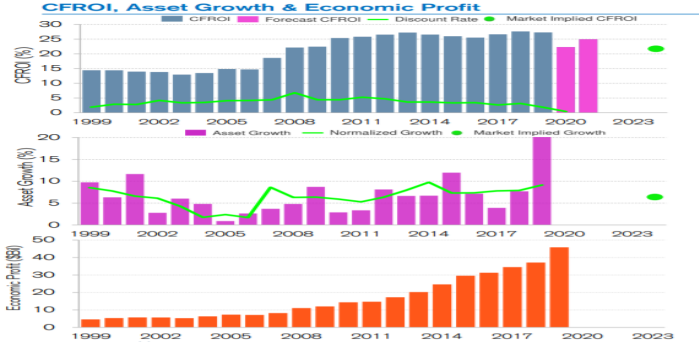
Digital Payments – The Rarity of High Returns on Capital + High Reinvestment: When compared to all sub-industries globally, Data Processing and Digital Payments stands out for both its exceptionally high CFROI levels and continued reinvestment. For more context versus other sub-industries, Digital Payments & Data Processing generates the second highest returns on capital with asset growth in the top 10% of all sub-industries. Note, the group earns its superior CFROI levels through a mix of both high operating margins and asset efficiency.

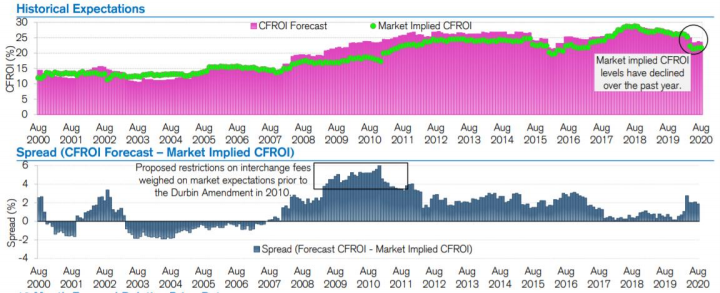
Digital Payments – Market Implied CFROI Has Declined as of Late: Market expectations have decreased for Digital Payments & Data Processing as the group has been impacted by lower transaction and cross border volumes due to COVID-19. The spread between near-term forecasts (pink bars) and market expectations (green dots) is the widest it has been since mid-2016.
Semiconductors – Sharp Improvement in CFROI Over the Last Decade: Semis have seen a quadrupling in CFROI over the last 7 years with CFROI and Economic Profit (EP) inflecting meaningfully higher over the past decade. The industry benefits from automation tailwinds, improving end-market dynamics, cloud infrastructure, and the data economy. Our semiconductor investments include Taiwan Semiconductor (TSM) and Nvidia (NVDA).
Semiconductors – Valuation: Market implied CFROI for Semi’s currently sits at the highest level since early 2000, while U.S. Semi’s has seen a decline in market implied CFROI in 2020 so far. This leaves Semis looking attractive with a large spread between CFROI Forecasts and Market Implied CFROI, as well as increasing CFROI forecasts based on strong industry fundamentals.
Blue vs Red Presidential Election Portfolio Tracker: A Post Convention Update
What follows is the current Blue vs Red portfolio status. I have mentioned this before, but it bears repeating that we started tracking these portfolios when we crossed the “100 days until election” date several weeks ago, but the real action will not start happening until well after Labor Day. I am particularly interested to see how these portfolios react in the aftermath of the first presidential debate. I would also be interested in seeing how these portfolios react if the former VP declines the invitation to debate. Joe Biden has consistently indicated that he will debate President Trump, but there’s a rising chorus within the Democratic Party that are urging him towards not participating led by House Speaker Nancy Pelosi.
We will save for another day the results to whatever path is chosen on the debates, and what follows is the status of the Red vs Blue Portfolios and the S&P 500. As you can see both portfolios have fallen behind the performance of the overall market. Perhaps investors believe more in the overall market then they do in either candidate?
Again, it is early. Stay tuned.
Catching Up
We look forward to catching up with each of you, and we will be reaching out to schedule a time to meet over the phone or by a Zoom/MS Teams video link. In the interim, if you would like to get something on the calendar, please send me a note with some dates and times.
Warm regards,
John